What Google's AI Performance Reports Actually Give You to Work With
Our measurement system has six steps: baseline, segment, monitor, validate, calculate, prioritize. The rest of this guide maps to that sequence. The 30-day plan runs each step in order, and the sections after it (the click-loss formula, the GSC-versus-GA4 split, the cosmetic-versus-revenue rule) are the reference material you pull from while executing each step.
If you run organic acquisition for a SaaS product, the problem you are trying to solve is concrete: impressions are climbing in Search Console while clicks sit flat or fall, and nobody on the team can say whether AI Overviews are eating your traffic or whether you are looking at normal ranking noise. The cost of guessing wrong is real. Cut budget on a query group that is still converting and you starve pipeline; chase vanity impressions that never produce a click and you burn a quarter optimizing pages that no longer earn traffic. This guide is the mechanism we use to separate the two.
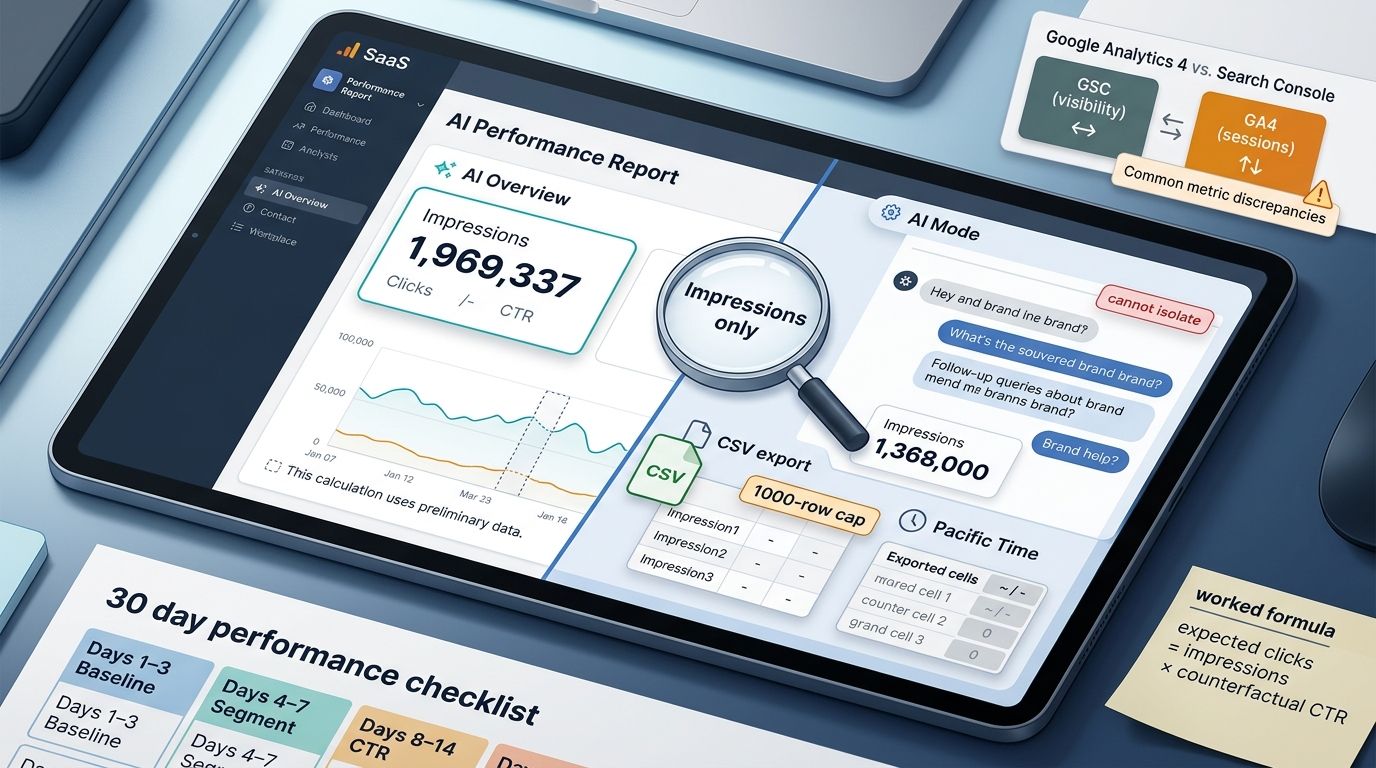
Google launched its Search Generative AI performance reports in Search Console on June 3, 2026, with separate views for Search (covering AI Overviews and AI Mode) and for Discover. Before you build anything on top of them, you need to understand exactly what they hand you, because the single most important constraint shapes the entire measurement plan: the dedicated report shows impressions only. Google's documentation lists no clicks, no CTR, no average position, and no query-level data in this first version.
The click data for AI Overviews and AI Mode does still exist, just not where you would want it. It is folded into the aggregate Performance report alongside every other Google search result, and there is no AI-only filter that isolates it. So you have two disconnected halves: a dedicated report that tells you where you appeared in AI features but never whether anyone clicked, and an aggregate report that counts the clicks but cannot tell you which ones came from an AI surface.
One source conflict is worth flagging before anyone wires up an export. Google's documentation and Brodie Clark's coverage describe the AI reports as impressions-only. A separate writeup (DigitalApplied) claims the reports include dedicated filters with full click and CTR metrics. That claim conflicts with Google's own description, so treat it as unverified and build against the impressions-only reality until Google's docs say otherwise.
Your property may not show the report at all yet, for one of three reasons:
- The rollout is still limited and your property has not been enabled.
- Your site has too few AI-feature impressions to populate the view.
- You opted out of AI features, which removes eligibility entirely.
The AI reports also inherit the quirks of the classic Performance report, and each one changes how an export reads. Tables cap at 1,000 rows, so a long-tail SaaS property will silently truncate. Dates are in Pacific Time, which matters the moment you join GSC data to a GA4 export on a different clock. The most recent days appear as preliminary data, shown as a dotted line in the chart, and should never anchor a trend call. And UI values that display as ~ or - export as zeros, which will quietly skew any sum you run in a spreadsheet. Finally, expect chart totals and table totals to differ legitimately: the chart aggregates at the property level while the table aggregates per page, so the two will rarely match to the unit.
[Screenshot: GSC Search Generative AI performance report, impressions-only view]
Why AI Overviews and AI Mode Must Be Measured as Two Separate Surfaces
AI Overviews and AI Mode are different products that happen to share a label. An AI Overview is the embedded summary that appears at the top of a normal results page, public since May 2024, sitting above the blue links. AI Mode is a separate conversational search experience, rolled out US-wide around June 2025, where the user asks, reads, and asks again inside a chat-style interface rather than scanning a SERP.
That conversational structure changes what counts as a query and an impression. AI Mode uses query fan-out, decomposing one user prompt into several background searches, and it treats follow-up questions as new queries (Aleyda Solís). So a single user session can generate multiple impression events across multiple synthesized answers, none of which maps cleanly to the one-query-one-SERP model that GSC was built around.
The evidence that these two surfaces are not interchangeable comes from Ahrefs' September 2025 analysis. The two features cite mostly different URLs (a 13.7% citation overlap across all citations) and share almost no exact wording (a word-level Jaccard similarity of 0.16), yet they say nearly the same thing (an average semantic similarity of 0.86). Same meaning, different sources. If you collapse them into one number, you hide the fact that the page winning your AI Overview citation may be invisible in AI Mode, and vice versa.
Brand exposure differs too. AI Mode answers name roughly 3.3 brands or people per response against roughly 1.3 in AI Overviews, and if your brand appears in an AI Overview there is about a 61% chance it also shows up in AI Mode. Source preferences diverge as well, with the two surfaces favoring different mixes of Wikipedia, Quora, YouTube, health sources, and a site's core pages. The reporting rule we enforce on every dashboard follows directly: never collapse AI Overview and AI Mode visibility into a single AI Search number, because the inputs, the citations, and the winners are different.
The Metrics and Exports to Lock Down Before Day 1
Capture everything before you start, because you cannot reconstruct a baseline after the fact. The full list spans two tools:
- From GSC: impressions, clicks, CTR, average position, and AI-feature impressions from the dedicated report (Google).
- From GA4: landing page sessions and conversions, joined on the landing page URL.
Know how each AI metric is counted, because the counting rules are where misreadings start. An AI Overview impression is registered only when your cited link is scrolled or expanded into view, and the entire overview is treated as a single position rather than a range of slots. AI Mode impressions, clicks, and position follow the conversational model, where follow-up questions are counted as new queries, so one session inflates the impression count relative to a traditional search.
Several aggregation rules distort AI metrics specifically, and you should expect them rather than be surprised by them:
- Property-level collapse: five page-level impressions on the same property can roll up to one property-level impression.
- One link per page: a page cited multiple times in a single AI feature counts once.
- Topmost-position reporting: only the highest position the page held is reported.
- Canonical attribution: impressions and clicks are credited to the canonical URL rather than the variant actually shown.
There is one bias worth naming because it cuts the other way. As Brodie Clark has pointed out, counting an AI Overview impression only after the user expands or scrolls to the citation means the denominator excludes everyone who never expanded, which can inflate the apparent CTR. His own experiment surfaced a 13.5% CTR that looked healthy precisely because the non-engaged impressions were never counted. Read high AI-surface CTR with that caveat in mind.
From these raw inputs we will derive three numbers the native reports never give you: expected clicks (what the impressions should have produced at a pre-AI CTR), counterfactual CTR (the CTR a comparable non-AI keyword set delivers), and real click loss (expected minus actual). Those three are the entire point of the 30-day plan.
The 30-Day Measurement Plan
The plan is six numbered steps mapped across 30 days. Each step produces an output the next step consumes:
- Export the baseline (Days 1–3)
- Segment query groups and pages (Days 4–7)
- Monitor CTR compression (Days 8–14)
- Validate with GA4 (Days 15–21)
- Calculate real click loss (Days 22–27)
- Report and prioritize (Days 28–30)
Step 1: Export the Baseline (Days 1–3)
Export GSC data for the full property, filtered to the Web search type, and immediately set aside the most recent preliminary days, since the dotted-line data will revise upward and contaminate any baseline that includes it. Your goal in these three days is a clean snapshot of how the property performed before AI features touched it.
Set the historical baseline using December 2023-style logic, meaning a window from before AI Overviews were live in your query space. Avoid any period where AI Overviews were already appearing, because a baseline measured after compression has already started understates the loss you are trying to quantify. Record baseline impressions, clicks, CTR, and average position per query group, working within the 1,000-row table cap (split exports by page folder or query filter if you exceed it) and keeping every timestamp in Pacific Time so it lines up with GA4 later.
[Screenshot: GSC Web search-type export with preliminary dotted-line dates highlighted]
Step 2: Segment Query Groups and Pages (Days 4-7)
Raw totals hide everything. Split your queries three ways:
- By surface: AI Overview-triggering, AI Mode-relevant, and traditional organic.
- By brand: branded versus non-branded.
- By intent: informational, commercial, and high-intent.
Use query length to predict AI exposure before the data confirms it. Pew's research found that 60% of question-word queries and 53% of queries with 10 or more words trigger an AI summary, so your long, natural-language, question-shaped queries are the ones most likely to lose clicks first. Flag them early.
Map page types to those query groups so you know what is exposed: product pages, comparison pages, documentation, blog posts, and landing pages each sit behind different intents and absorb AI compression differently. Then tag every query group with revenue relevance. A high-intent comparison page losing clicks is a fire; an informational blog post losing cosmetic impressions is not. Tagging this on Day 4 means cosmetic exposure is visible from the start, before anyone panics over a chart.
[Internal example: revenue-relevant comparison-query segment dashboard, with pricing-page query group tagged "defend" and definitional blog queries tagged "ignore"]
Step 3: Monitor CTR Compression (Days 8–14)
Track CTR and impressions per segment against the baseline you built in Step 1. The pattern to watch for is impressions up sharply while clicks barely move, the signature of AI compression. A segment showing impressions up 40% with clicks up 5% is being shown more and clicked less, which is exactly what AI Overviews do.
Apply position-specific CTR loss benchmarks from Ahrefs so you know what magnitude is normal when an AI Overview is present. The clearest published figures put CTR loss at roughly −58% at position 1 and around −19.4% at position 10, with intermediate positions falling between those two. If your position-1 segment lost 30% of clicks, that is less than the benchmark and may be partly something else; if it lost 70%, something beyond the AI Overview is also in play.
Do not stop monitoring at the top result. Roughly 9% of AI Overviews appear outside the first organic position, so a page ranking fourth can still sit below an overview and bleed clicks (Ahrefs). And separate AI-driven compression from the broader zero-click trend: if your non-AI keywords are also losing CTR over the same window, the cause is wider than AI features, and attributing all of it to AI Overviews will send you optimizing for the wrong thing.
Step 4: Validate with GA4 (Days 15–21)
GSC tells you Google showed and clicked your result; GA4 tells you what happened after the click. Before any comparison, filter GA4 to source = google and add the hostname dimension, because without the hostname you will pull in sessions from staging, subdomains, or spoofed referrers and call them organic.
Then run the discrepancy diagnostic. If GSC clicks are flat while GA4 organic sessions rise, the gap is not coming from Google, and you should investigate non-Google sources, referrer spoofing, stray UTMs, duplicate analytics tags, and cross-domain setup before concluding anything about AI. Expect the two tools to disagree by large margins as a matter of course. One Reddit case study documented 205 GA4 sessions against 2 GSC clicks for the same page, which is normal rather than broken: GA4 counts a session whenever a user lands, while GSC counts a click only on a Google search result, and those two events diverge constantly.
Step 5: Calculate Real Click Loss (Days 22–27)
This is where the plan earns its keep. The raw decline in clicks is never the AI-specific loss, because part of it is the general zero-click drift affecting every keyword. To isolate the AI portion, use a control group of non-AI informational keywords and subtract their decline.
The Ahrefs method shows the arithmetic. At position 1, the raw CTR decline was 78.4%. General compression across the control set accounted for 48.6 points of that. After normalizing the raw figure against the general-compression baseline rather than subtracting the percentages directly, the AI-specific share comes out to roughly 58% at position 1, which is the number you can defend in a meeting.
Run the worked example on one segment to make it concrete. Take a query group with an 8% baseline CTR and 10,000 impressions. At baseline that group should produce 800 expected clicks. Observed clicks come in at 520. The loss is 280 clicks, a 35% loss rate. That 280 is the figure you tie to revenue instead of the impression count.
Finally, flag the segments where impressions are high but clicks are near zero. The marker we use is the documented anecdote of 797,444 impressions against 7 clicks, which is cosmetic visibility: the brand is being shown, almost nobody is clicking, and there is no traffic to defend even though the impression chart looks like a win.
Step 6: Report and Prioritize (Days 28-30)
Assemble the dashboard from the numbers you have collected. It should hold these sections:
- AI Overview impressions and AI Mode impressions, kept separate per the rule above.
- Organic clicks and CTR by query group.
- Landing page sessions from GA4.
- Conversion rate by affected page.
- Expected versus actual clicks.
- Estimated click loss per segment.
Then write decision rules against it. Which segments lost revenue-relevant clicks (defend and optimize), which lost only cosmetic exposure (ignore), and which moved because of a ranking change or seasonality rather than AI (confirm before acting). Set the next reporting cadence and define a trend window long enough to absorb the preliminary-data days. We run a window of at least seven to fourteen days as our operating choice, which prevents anyone from overreacting to a single preliminary-data day.
Here is the plan in one view:
| Step | Days | What you do | Output |
|---|---|---|---|
| 1. Baseline | 1–3 | Export Web search data, set pre-AI window | Baseline impressions, clicks, CTR, position per group |
| 2. Segment | 4–7 | Split by surface, brand, intent; map page types; tag revenue relevance | Segmented query and page inventory |
| 3. Compression | 8–14 | Track CTR vs baseline, apply position benchmarks | Flagged compressing segments |
| 4. GA4 validation | 15–21 | Filter to Google + hostname, run discrepancy diagnostic | Confirmed click-vs-session gaps |
| 5. Click loss | 22–27 | Subtract control-group decline, run the formula | AI-specific click loss per segment |
| 6. Report | 28–30 | Build dashboard, write decision rules, set cadence | Prioritized action list |
The Real Click Loss Formula, Worked Step by Step
The formula is four lines:
expected clicks   = impressions × counterfactual CTR
actual clicks     = impressions × observed CTR
loss              = expected clicks − actual clicks
loss percentage   = loss / expected clicks
The line that does the real work is the counterfactual CTR, and it is the one people get wrong by guessing. Build it from a non-AI control group instead. Pick a set of informational keywords in your space where no AI Overview appears, measure their current CTR, and use that as the counterfactual, because it already absorbs the general zero-click drift and leaves only the AI-specific gap when you compare it to your AI-affected segment.
Run it on the example from Step 5. With a baseline (counterfactual) CTR of 8% and 10,000 impressions, expected clicks come to 800. With an observed CTR of 5.2%, actual clicks are 520. The loss is 280 clicks, and 280 divided by 800 gives a 35% loss rate. That number connects directly to whatever a click is worth to the affected page.
Three mistakes invalidate the whole calculation:
- Skipping the baseline subtraction, which lets general compression masquerade as AI loss.
- Using a post-AI baseline, which understates the loss because compression already started before your window.
- Treating the raw decline as fully AI-attributable, which is the 78.4% figure with the 48.6 points of general compression never removed.
GSC vs GA4: Dividing the Measurement Work
| Tool | Best for | AI Search visibility | Click / session tracking | Conversion tracking | Main limitation |
|---|---|---|---|---|---|
| GSC | Whether Google showed and clicked your result | Yes (impressions only, AI report) | Clicks on Google results | No | No clicks/CTR/queries in the AI report; 1,000-row cap |
| GA4 | What happened after the click | No | Sessions from any source | Yes | Cannot tell you the AI surface or whether Google showed you |
GA4 sessions and GSC clicks are never 1:1 (Search Engine Journal). GA4 can report higher when non-Google traffic leaks into the organic segment, or when referrer spoofing inflates the count. GA4 can report lower when the tag is suppressed or when a clicked page never fires the tag. The 205-versus-2 case study sits at the high-divergence end of that range, and it is not an error.
Both tools share one blind spot: when your brand is named in AI-generated text without a clickable cited link, no GSC impression is generated at all, so neither tool sees the exposure. GSC is sufficient when you need impression coverage and aggregate click trends. Add manual SERP checks when you need to confirm an AI Overview is actually present on a target query, rank tracking when you need position history the AI report does not provide, and server logs when you suspect the tag-based numbers are missing real traffic.
How to Read a Cosmetic vs Revenue-Relevant Result
The decision rule that separates vanity gains from qualified demand is simple to state: an impression gain matters only if it produces clicks that reach a page tied to conversion. The 797,444 impressions against 7 clicks pattern is the canonical cosmetic result, where the chart climbs and the funnel sees nothing.
Connect each AI-affected query group to its funnel stage and pull the conversion data from GA4 for the pages behind it. A non-branded comparison query feeding a pricing page sits deep in the funnel and is worth defending; a definitional informational query feeding a top-of-funnel blog post that has never converted is worth letting go.
When AI Overviews are compressing clicks on a revenue-relevant page, four moves are on the table:
- Strengthen the snippet's value with unique data the AI summary cannot fully reproduce, so the click is still worth making.
- Target deeper-intent queries where AI Overviews trigger less and the user still needs your page.
- Build entity signals so your brand is the named source inside the AI answer.
- Optimize post-click value so the smaller click volume converts at a higher rate.
Before any of that, confirm the drop is AI. A click drop can be ranking volatility, seasonality, or a shift in query mix where a high-CTR term simply got searched less. Confirm it by checking whether average position moved (ranking), whether the same period last year shows the same dip (seasonality), and whether your non-AI control group dropped in parallel (broader drift rather than AI). Act only after one of those rules out the alternatives.
Should You Block Content From AI Overviews or AI Mode
Blocking controls keep your content out of AI features, and the tradeoff is direct: you protect the content from being summarized, and you lose the discovery and citation exposure that comes with appearing in the AI surface. For most SaaS content the citation is still a brand-placement opportunity, so blocking is rarely the default answer.
A workable decision framework:
- Block when the content is a proprietary asset whose value collapses the moment it is summarized, and where being cited produces no offsetting benefit.
- Monitor when you are unsure, since you can always block later but cannot recover the baseline you failed to capture.
- Optimize when the page is revenue-relevant and appearing in the AI surface drives qualified clicks or brand exposure you want.
One consequence settles the matter for most teams: opting out of AI features removes your eligibility from the AI performance report entirely, so you lose the very visibility data this plan is built on (Google Search Central). Block in narrow, deliberate cases, not as a blanket policy.
Where SaaS Teams Get Stuck Next
After month one, the one number to watch is AI-specific click loss on revenue-relevant query groups, not total AI impressions. Total impressions will keep climbing and will keep looking like progress, but the figure that ties to pipeline is the click loss on the segments you tagged as revenue-relevant in Step 2. That is the metric that survives a budget conversation.
Commit to a cadence or the dashboard decays into a vanity report. Weekly review of the compressing segments, monthly recalculation of click loss against the baseline, and a fixed trend window of at least a week keeps the team responding to signal rather than to a single preliminary-data spike. The discipline of waiting out the dotted line is what separates a decision tool from a panic dashboard.
The next validation step to add, once the 30-day baseline is stable, is direct SERP confirmation: spot-check your highest-value query groups to verify an AI Overview is actually present and that you are cited in it, since the impressions-only report tells you that you appeared somewhere in AI features but never shows you the query or the exact placement. Layering manual checks or a rank tracker onto the stable baseline closes the gap the native report leaves open.
FAQ
What does the GSC performance report show, and what does the new AI report add? The classic Performance report shows clicks, impressions, CTR, and average position for your Google search results, with query and page breakdowns. The Search Generative AI report, launched June 3, 2026, adds impressions for AI Overviews and AI Mode. It does not add clicks, CTR, position, or queries in this first version.
Can GSC show AI Overview traffic, and does it report AI Mode clicks? GSC shows AI Overview and AI Mode impressions in the dedicated report. It does not report AI Mode clicks there. AI click data exists only inside the aggregate Performance report, mixed with all other Google results, with no AI-only filter to isolate it.
What is the difference between AI Overviews and AI Mode for reporting? AI Overviews are the summary embedded at the top of a normal results page; AI Mode is a separate conversational experience where follow-up questions count as new queries. Ahrefs found a 13.7% citation overlap and 0.16 word-level Jaccard similarity between them despite 0.86 semantic similarity, so they cite different sources and must be reported as two surfaces, never one combined number.
How do you calculate real click loss from AI features? Multiply impressions by a counterfactual CTR (taken from a non-AI control group) to get expected clicks, multiply impressions by the observed CTR to get actual clicks, and subtract. At an 8% baseline CTR over 10,000 impressions, expected clicks are 800; at a 5.2% observed CTR, actual clicks are 520, a loss of 280 clicks, or 35%. Subtract the control group's general decline so you isolate the AI-specific portion rather than the raw drop.
What is the difference between GSC and GA4 for AI search measurement?
GSC answers whether Google showed and clicked your result, including AI-feature impressions. GA4 answers what happened after the click, including sessions and conversions. They are never 1:1, with one documented case showing 205 GA4 sessions against 2 GSC clicks, so expect large, normal discrepancies and filter GA4 to source = google with the hostname dimension before comparing.
Is the GSC API free, and can it isolate AI Overview impressions? On the isolation question, the API cannot separate AI Overview clicks from the aggregate Performance report, because no AI-only click filter exists. The dedicated AI report exposes impressions only, so any click-loss calculation has to be derived by combining the impression data with a baseline CTR rather than pulled directly.